Market Outlook
July 3, 2017
Market Cues
Domestic Indices
Chg (%)
(Pts)
(Close)
Indian markets are likely to open flat tracking SGX Nifty and global indices.
BSE Sensex
0.2
64
30,922
After seeing a modest strength for much of the session, the major US indices lost the
Nifty
0.2
17
9,521
ground by closing on Friday. The tech-heavy Nasdaq pulled back into negative
Mid Cap
0.6
92
14,644
territory, while the Dow and the S&P 500 remained positive. Nasdaq edged down
Small Cap
0.7
100
15,411
0.1 percent to 6,140, the Dow rose 0.3 percent to 21,350 and the S&P 500 closed
Bankex
0.0
0
26,278
up 0.2 percent to 2,423.
Stocks in the U.K. fell on Friday on a report of paltry economic growth and a rising
Global Indices
Chg (%)
(Pts)
(Close)
pound. The FTSE 100 index ended 0.5% lower at 7,313, losing grip of a small
intraday gain after the pound pulled back from a six-week high.
Dow Jones
0.3
63
21,350
Nasdaq
(0.1)
(4)
6,140
India equity markets showed some strength on the first session of the July derivatives
FTSE
(0.5)
(38)
7,313
series on Friday, with the BSE Sensex gaining about 0.21% to 30,922 and Nifty
Nikkei
(0.9)
(187)
20,033
gaining 0.18% to 9,521 ahead of GST rollout. Indian markets closed positive
despite weakness in the global markets. This positive closing reflected the optimistic
Hang Seng
(0.8)
(201)
25,765
mood on the street on the rollout of the new indirect tax regime which came into
Shanghai Com
0.1
4
3,192
reality on 1st July 2017.
Advances / Declines
BSE
NSE
News Analysis
Advances
1,321
831
GST to boost economic growth
Maruti Suzuki June-2017 Sales
Declines
1,259
827
Unchanged
186
75
Detailed analysis on Pg2
Investor’s Ready Reckoner
Volumes (` Cr)
Key Domestic & Global Indicators
BSE
3,080
Stock Watch: Latest investment recommendations on 150+ stocks
NSE
23,336
Refer Pg6 onwards
#Net Inflows (` Cr)
Net
Mtd
Ytd
Top Picks
CMP
Target
Upside
Company
Sector
Rating
FII
(732)
2,485
54,454
(`)
(`)
(%)
MFs
21
6,954
36,994
Blue Star
Capital Goods
Buy
601
760
26.5
Dewan Housing Fin. Financials
Buy
437
520
18.9
Mahindra Lifespace Real Estate
Buy
431
522
21.2
Top Gainers
Price (`)
Chg (%)
Navkar Corporation Others
Buy
202
265
31.1
Gvkpil
9
16.2
KEI Industries
Capital Goods
Accumulate
232
258
11.0
More Top Picks on Pg5
Natcopharm
1,009
7.7
Bluedart
4,713
7.1
Key Upcoming Events
Punjlloyd
20
6.1
Previous
Consensus
Date
Region
Event Description
Reading
Expectations
Beml
1,534
5.3
Jul 3, 2017
Germany PMI Manufacturing
59.30
59.30
Jul 3, 2017
UK
PMI Manufacturing
56.70
56.30
Top Losers
Price (`)
Chg (%)
Jul 5, 2017
US
Initial Jobless claims
244.00
243.00
Ibrealest
200
(4.3)
Jul 6, 2017
Germany PMI Services
53.70
53.70
Jul 7, 2017
UK
Industrial Production (YoY)
(0.80)
0.20
Jpassociat
22
(3.7)
More Events on Pg5
Navkarcorp
205
(2.9)
Escorts
645
(2.9)
Sintex
24
(2.8)
#as on 30t June, 2017
Market Outlook
July 3, 2017
News Analysis
GST to boost economic growth
The most awaited tax reform i.e. Goods and Service Tax (GST) became a reality on
1st July 2017. GST, with the five different tax slabs (i.e. 0%, 5%, 12%, 18% and
28%) has overhauled the indirect tax regime in India. With the new tax system in
place, economic growth is expected to increase by ~1-2%.
With the single tax throughout the country, there will not be differential pricing in
the different states which allows the companies to store their goods in few large
sized warehouses rather than multiple regional warehouses. This will help in
reducing the logistics costs and bringing more efficiency in operations which will
be helpful to the companies.
On the government side, GST offers less tax invasion and more tax collection
which will be positive for improving macros further. With the unified indirect tax
regime, ease of doing business ranking is also expected to improve which will help
in getting more FII inflows in the country. While there may be some teething
problems in the beginning, overall, we expect GST to be a positive step for the
country.
Maruti Suzuki June-2017 Sales
Maruti Suzuki's June sales grew by 7.6% to 1.06 lakh vehicles. The domestic PV
sales grew by 1% yoy to 93,057 units. While the entry level car segment saw a
decline of 8%, premium category sales grew by more than 40% indicating that the
company has kept trend of strong growth in the premium category vehicles i.e.
Ciaz, Vitara Brezza, S-Cross, etc. Total exports grew by 96% yoy to 13,131 units
in the month.
In June, due to the run up to the GST, customers were seen deferring the vehicle
purchases hence company had reduced the dispatches to the dealers as well as
had announced some discounts. With the GST implemented, company has now
fully passed on the GST benefit to its customers by cutting the car prices by about
3% in most categories. However the vehicle prices in hybrid vehicle categories
have seen mild increase.
Economic and Political News
GST to boost India's GDP growth, positive for rating: Moody's
RBI report warns of more NPA pain, sees bad loans topping 10% by March-18
Non-food credit grows at 4.5% in April as industries contract
GST, 7th Pay Commission allowances to bump up inflation temporarily: HSBC
Forex reserves at new life-time high of $382.53 billion
Corporate News
Aurobindo looks to push deeper into EU, US over next 3-4 years
Hero MotoCorp cuts prices to pass on GST benefits
GST ushers in price cuts from carmakers, but hits auto sales in June
UltraTech-Jaypee cement deal closed in relief to banks
Market Outlook
July 3, 2017
Top Picks HHHHH
Market Cap
CMP
Target
Upside
Company
Rationale
(` Cr)
(`)
(`)
(%)
Strong growth in domestic business due to its leadership
in acute therapeutic segment. Alkem expects to launch
Alkem Laboratories
22,186
1,856
2,161
16.5
more products in USA, which bodes for its international
business.
We expect the company would report strong profitability
Asian Granito
1,296
431
447
3.8
owing to better product mix, higher B2C sales and
amalgamation synergy.
Favourable outlook for the AC industry to augur well for
Cooling products business which is out pacing the market
Blue Star
5,745
601
760
26.5
growth. EMPPAC division's profitability to improve once
operating environment turns around.
With a focus on the low and medium income (LMI)
consumer segment, the company has increased its
Dewan Housing Finance
13,708
437
520
18.9
presence in tier-II & III cities where the growth opportunity
is immense.
Loan growth is likely to pick up after a sluggish FY17.
Karur Vysya Bank
8,744
145
160
10.6
Lower credit cost will help in strong bottomline growth.
Increasing share of CASA will help in NIM improvement.
Economic recovery to have favourable impact on
advertising & circulation revenue growth. Further, the
Jagran Prakashan
5,966
183
225
23.3
acquisition of a radio business (Radio City) would also
boost the company's revenue growth.
High order book execution in EPC segment, rising B2C
KEI Industries
1,808
232
258
11.0
sales and higher exports to boost the revenues and
profitability
Speedier execution and speedier sales, strong revenue
Mahindra Lifespace
2,210
431
522
21.2
visibilty in short-to-long run, attractive valuations
Massive capacity expansion along with rail advantage at
Navkar Corporation
2,882
202
265
31.1
ICD as well CFS augurs well for the company
Strong brands and distribution network would boost
Siyaram Silk Mills
1,871
1,996
2,500
25.3
growth going ahead. Stock currently trades at an
inexpensive valuation.
Market leadership in Hindi news genre and no.
2
viewership ranking in English news genre, exit from the
TV Today Network
1,425
239
344
44.0
radio business, and anticipated growth in ad spends by
corporates to benefit the stock.
Source: Company, Angel Research,
Market Outlook
July 3, 2017
Key Upcoming Events
Global economic events release calendar
Bl oomberg Data
D ate
Time
C ountry
Event Description
Unit
Period
L ast Reporte d
E stimate d
Jul 03, 2017
1:25 PMGermany PMI Manufacturing
Value
Jun F
59.30
59.30
2:00 PMUK
PMI Manufacturing
Value
Jun
56.70
56.30
Jul 05, 2017
6:00 PMUS
Initial Jobless claims
Thousands
Jul 1
244.00
243.00
Jul 06, 2017
1:25 PMGermany PMI Services
Value
Jun F
53.70
53.70
Jul 07, 2017
2:00 PMUK
Industrial Production (YoY)
% Change
May
(0.80)
0.20
India
Imports YoY%
% Change
Jun
33.10
6:00 PMUS
Change in Nonfarm payrolls
Thousands
Jun
138.00
177.00
Jul 10, 2017
6:00 PMUS
Unnemployment rate
%
Jun
4.30
4.30
India
Exports YoY%
% Change
Jun
8.30
7:00 AMChina
Consumer Price Index (YoY)
% Change
Jun
1.50
1.50
Jul 12, 2017
2:00 PMUK
Jobless claims change
% Change
Jun
7.30
5:30 PMIndia
Industrial Production YoY
% Change
May
3.10
Jul 13, 2017
US
Producer Price Index (mom)
% Change
Jun
(0.70)
China
Exports YoY%
% Change
Jun
8.70
8.40
Jul 14, 2017
6:45 PMUS
Industrial Production
%
Jun
-
0.30
6:00 PMUS
Consumer price index (mom)
% Change
Jun
(0.10)
-
12:00 PMIndia
Monthly Wholesale Prices YoY%
% Change
Jun
2.17
Jul 17, 2017
7:30 AMChina
Real GDP (YoY)
% Change
2Q
6.90
7:30 AMChina
Industrial Production (YoY)
% Change
Jun
6.50
Jul 18, 2017
2:30 PMEuro Zone Euro-Zone CPI (YoY)
%
Jun F
1.30
2:00 PMUK
CPI (YoY)
% Change
Jun
2.90
Source: Bloomberg, Angel Research
Market Outlook
July 3, 2017
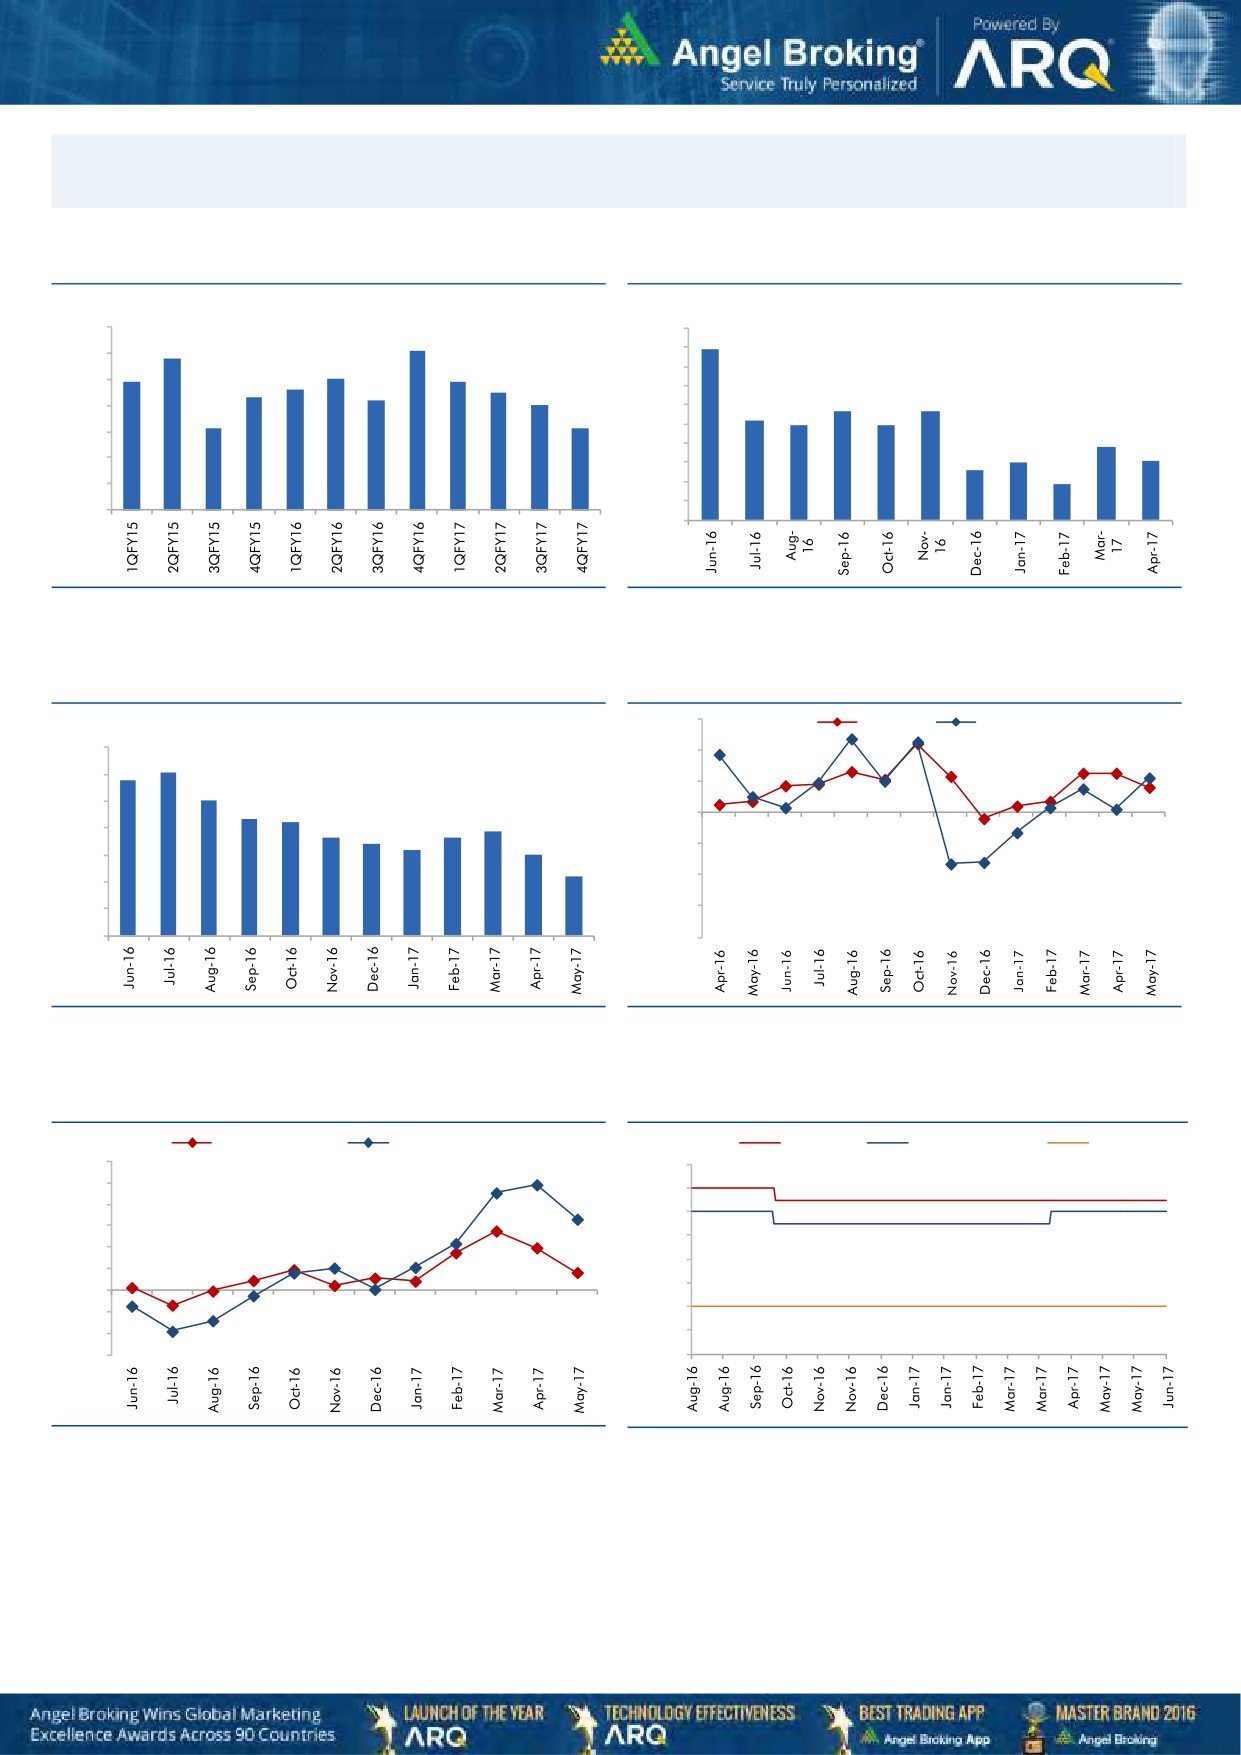
Macro watch
Exhibit 1: Quarterly GDP trends
Exhibit 2: IIP trends
(%)
(%)
10.0
10.0
9.1
8.9
8.8
9.0
9.0
7.9
8.0
7.9
8.0
7.6
7.5
8.0
7.3
7.2
7.0
7.0
5.7
5.7
7.0
6.0
5.2
6.1
6.1
4.9
4.9
6.0
5.0
3.8
4.0
3.0
3.1
2.6
5.0
3.0
1.9
4.0
2.0
1.0
3.0
-
Source: CSO, Angel Research
Source: MOSPI, Angel Research
Exhibit 3: Monthly CPI inflation trends
Exhibit 4: Manufacturing and services PMI
56.0
Mfg. PMI
Services PMI
(%)
7.0
54.0
6.1
5.8
6.0
5.1
52.0
5.0
4.3
4.2
3.9
50.0
3.6
3.7
4.0
3.4
3.2
3.0
48.0
3.0
2.2
46.0
2.0
1.0
44.0
-
42.0
Source: MOSPI, Angel Research
Source: Market, Angel Research; Note: Level above 50 indicates expansion
Exhibit 5: Exports and imports growth trends
Exhibit 6: Key policy rates
(%)
Exports yoy growth
Imports yoy growth
(%)
Repo rate
Reverse Repo rate
CRR
60.0
7.00
50.0
6.50
40.0
6.00
30.0
5.50
20.0
5.00
10.0
4.50
0.0
4.00
(10.0)
(20.0)
3.50
(30.0)
3.00
Source: Bloomberg, Angel Research
Source: RBI, Angel Research
Market Outlook
July 3, 2017
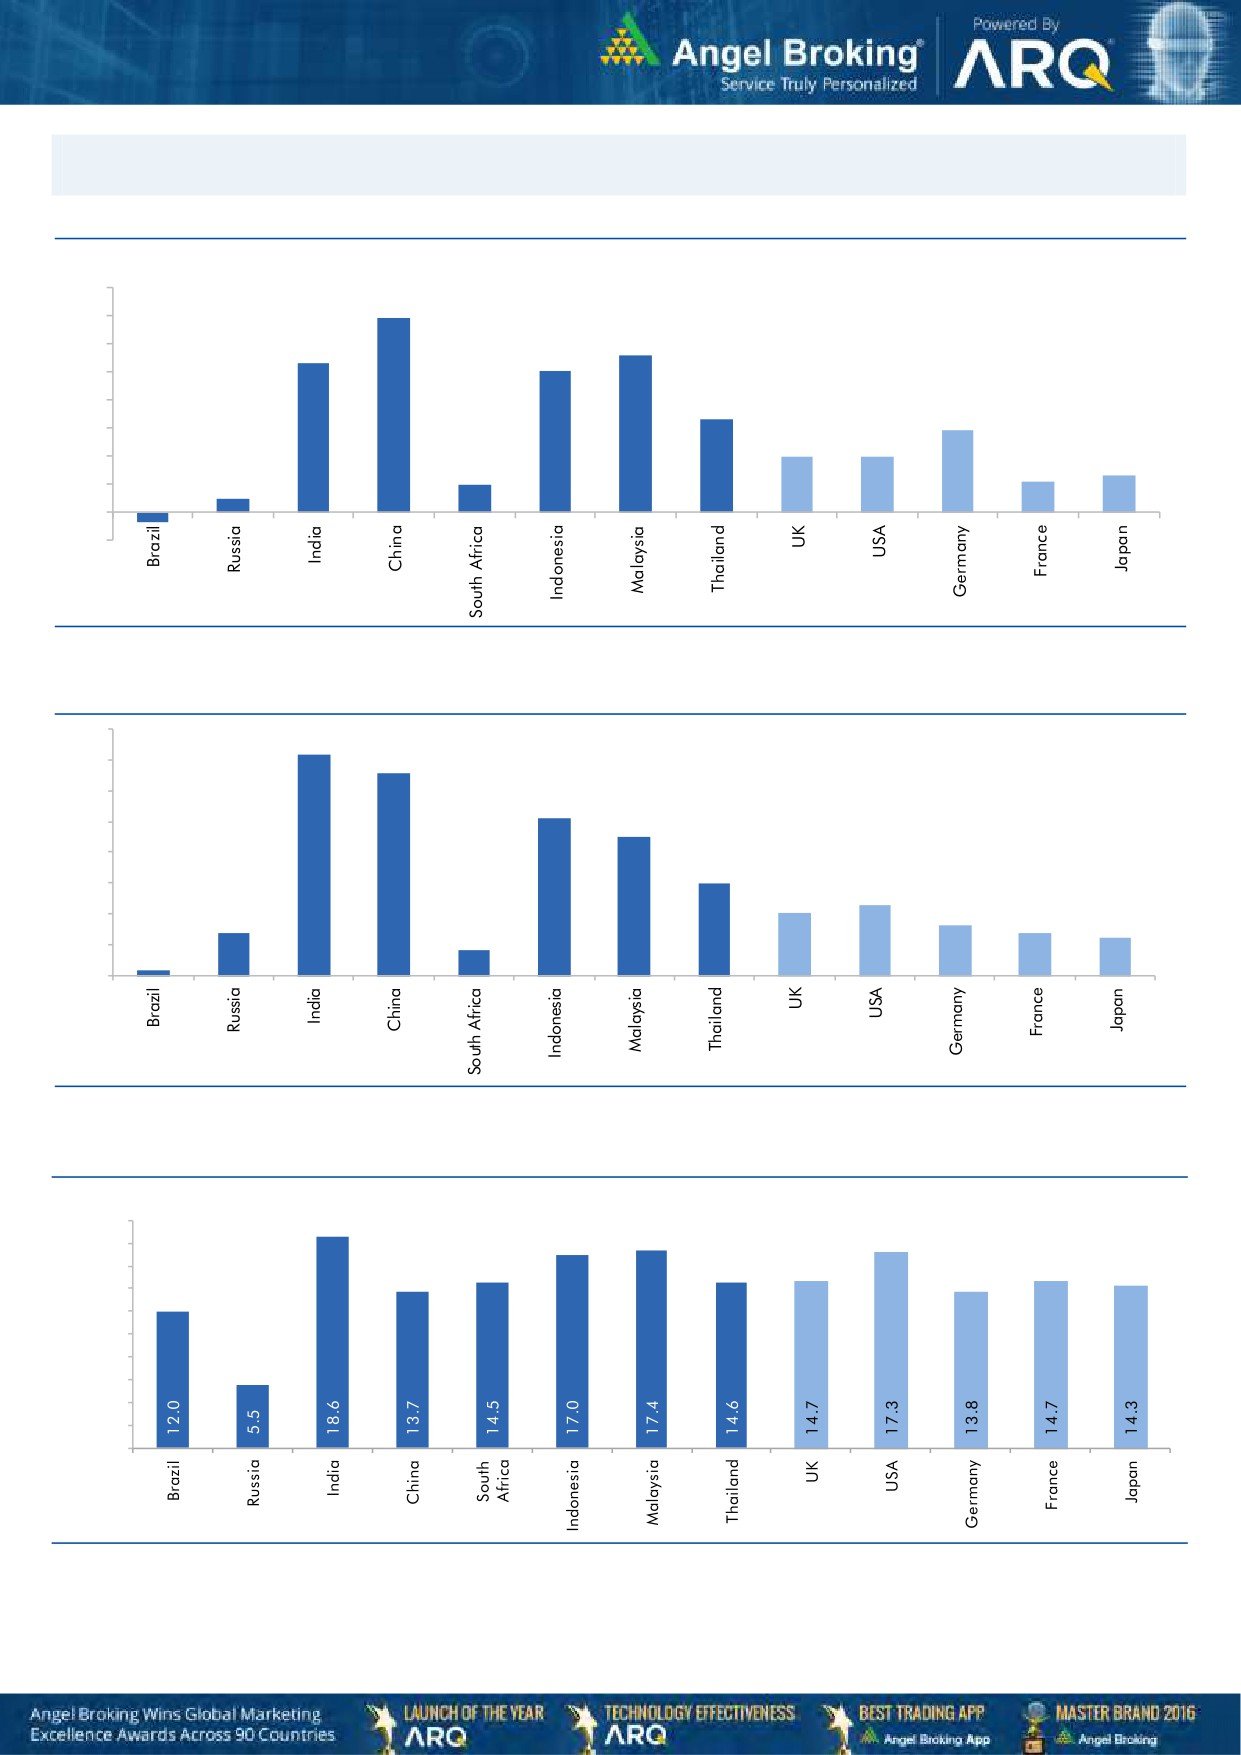
Global watch
Exhibit 1: Latest quarterly GDP Growth (%, yoy) across select developing and developed countries
(%)
8.0
6.9
7.0
5.6
6.0
5.3
5.0
1.0
5.0
4.0
3.3
2.9
3.0
2.0
2.0
0.5
2.0
1.1
1.3
1.0
-
(1.0)
(0.4)
Source: Bloomberg, Angel Research
Exhibit 2: 2016 GDP Growth projection by IMF (%, yoy) across select developing and developed countries
(%)
7.2
7.0
6.6
6.0
5.1
5.0
4.5
4.0
3.0
3.0
2.3
2.0
1.4
1.6
2.0
1.4
1.2
0.2
0.8
1.0
-
Source: IMF, Angel Research
Exhibit 3: One year forward P-E ratio across select developing and developed countries
(x)
20.0
18.0
16.0
14.0
12.0
10.0
8.0
6.0
4.0
2.0
-
Source: IMF, Angel Research
Market Outlook
July 3, 2017
Exhibit 4: Relative performance of indices across globe
Returns (%)
C ountry
Name of index
Closing price
1M
3M
1YR
Brazil
Bovespa
62,900
(1.7)
(2.7)
25.8
Russia
Micex
1,880
(2.8)
(7.5)
(1.5)
India
Nifty
9,521
(1.1)
4.6
17.7
China
Shanghai Composite
3,192
2.4
(2.3)
10.5
South Africa
Top 40
45,422
(4.8)
1.7
0.7
Mexico
Mexbol
49,857
2.2
1.7
7.9
Indonesia
LQ45
978
0.7
8.6
17.1
Malaysia
KLCI
1,764
(0.5)
1.1
7.9
Thailand
SET 50
994
0.8
(0.1)
8.9
USA
Dow Jones
21,350
1.6
3.0
18.9
UK
FTSE
7,313
(2.8)
(0.4)
12.1
Japan
Nikkei
20,033
1.9
4.2
23.4
Germany
DAX
12,325
(2.2)
1.4
31.5
France
CAC
5,121
(3.1)
1.0
22.2
Source: Bloomberg, Angel Research,
Stock Watch
July 03, 2017
Company Name
Reco
CMP
Target
Mkt Cap
Sales ( Čcr )
OPM(%)
EPS (Č)
PER(x)
P/BV(x)
RoE(%)
EV/Sales(x)
(Č)
Price ( Č)
( Č cr )
FY17E FY18E
FY17E
FY18E
FY17E
FY18E
FY17E
FY18E
FY17E
FY18E
FY17E
FY18E
FY17E
FY18E
Agri / Agri Chemical
Rallis
Reduce
242
209
4,713
1,937
2,164
13.3
14.3
9.0
11.0
26.9
22.0
4.7
4.1
18.4
19.8
2.5
2.2
United Phosphorus
Neutral
840
-
42,693
15,176
17,604
18.5
18.5
37.4
44.6
22.5
18.8
4.4
3.7
21.4
21.2
2.9
2.5
Auto & Auto Ancillary
Ashok Leyland
Buy
94
111
27,466
20,021
21,915
11.6
11.9
4.5
5.3
20.9
17.6
4.3
3.8
20.6
21.5
1.3
1.2
Bajaj Auto
Neutral
2,791
-
80,748
25,093
27,891
19.5
19.2
143.9
162.5
19.4
17.2
5.4
4.7
30.3
29.4
2.9
2.6
Bharat Forge
Neutral
1,092
-
25,416
7,726
8,713
20.5
21.2
35.3
42.7
30.9
25.6
5.7
5.2
18.9
20.1
3.4
2.9
Eicher Motors
Neutral
27,039
-
73,607
16,583
20,447
17.5
18.0
598.0
745.2
45.2
36.3
15.5
11.8
41.2
38.3
4.3
3.4
Gabriel India
Neutral
151
-
2,166
1,544
1,715
9.0
9.3
5.4
6.3
27.9
23.9
5.3
4.7
18.9
19.5
1.4
1.2
Hero Motocorp
Neutral
3,697
-
73,822
28,083
30,096
15.3
15.7
171.8
187.0
21.5
19.8
7.5
6.3
30.1
27.9
2.5
2.2
Jamna Auto Industries Neutral
249
-
1,987
1,486
1,620
9.8
9.9
15.0
17.2
16.6
14.5
3.6
3.1
21.8
21.3
1.4
1.3
L G Balakrishnan & Bros Neutral
748
-
1,174
1,302
1,432
11.6
11.9
43.7
53.0
17.1
14.1
2.4
2.2
13.8
14.2
1.0
0.9
Mahindra and Mahindra Neutral
1,348
-
83,702
46,534
53,077
11.6
11.7
67.3
78.1
20.0
17.3
3.3
2.8
15.4
15.8
1.8
1.5
Maruti
Neutral
7,218
-
218,038
67,822
83,288
16.0
16.4
253.8
312.4
28.4
23.1
6.5
5.3
23.0
22.9
2.9
2.3
Minda Industries
Neutral
640
-
5,534
2,728
3,042
9.0
9.1
68.2
86.2
9.4
7.4
2.1
1.7
23.8
24.3
2.1
1.8
Motherson Sumi
Neutral
460
-
64,543
45,896
53,687
7.8
8.3
13.0
16.1
35.3
28.6
11.4
9.1
34.7
35.4
1.5
1.2
Rane Brake Lining
Neutral
1,318
-
1,043
511
562
11.3
11.5
28.1
30.9
46.9
42.6
7.2
6.5
15.3
15.0
2.2
2.0
Setco Automotive
Neutral
37
-
491
741
837
13.0
13.0
15.2
17.0
2.4
2.2
0.4
0.4
15.8
16.3
1.0
1.0
Tata Motors
Neutral
433
-
124,878
300,209
338,549
8.9
8.4
42.7
54.3
10.1
8.0
1.6
1.4
15.6
17.2
0.5
0.5
TVS Motor
Neutral
549
-
26,104
13,390
15,948
6.9
7.1
12.8
16.5
43.1
33.2
10.7
8.5
26.3
27.2
2.0
1.6
Amara Raja Batteries
Buy
838
1,009
14,315
5,305
6,100
16.0
16.3
28.4
34.0
29.5
24.7
5.7
4.8
19.3
19.3
2.7
2.3
Exide Industries
Neutral
220
-
18,696
7,439
8,307
15.0
15.0
8.1
9.3
27.2
23.7
3.8
3.4
14.3
16.7
2.1
1.9
Apollo Tyres
Neutral
241
-
12,268
12,877
14,504
14.3
13.9
21.4
23.0
11.2
10.5
1.8
1.5
16.4
15.2
1.1
1.0
Ceat
Neutral
1,796
-
7,265
7,524
8,624
13.0
12.7
131.1
144.3
13.7
12.5
2.5
2.1
19.8
18.6
1.0
0.9
JK Tyres
Neutral
160
-
3,639
7,455
8,056
15.0
15.0
21.8
24.5
7.4
6.6
1.5
1.3
22.8
21.3
0.6
0.5
Swaraj Engines
Neutral
2,346
-
2,914
660
810
15.2
16.4
54.5
72.8
43.0
32.2
13.4
12.2
31.5
39.2
4.2
3.4
Subros
Neutral
241
-
1,447
1,488
1,681
11.7
11.9
6.4
7.2
37.7
33.7
4.0
3.6
10.8
11.4
1.2
1.0
Indag Rubber
Neutral
208
-
546
286
326
19.8
16.8
11.7
13.3
17.8
15.6
3.0
2.8
17.8
17.1
1.6
1.4
Capital Goods
ACE
Neutral
68
-
672
709
814
4.1
4.6
1.4
2.1
48.5
32.4
2.0
1.9
4.4
6.0
1.1
1.0
BEML
Neutral
1,534
-
6,390
3,451
4,055
6.3
9.2
31.4
57.9
48.9
26.5
2.9
2.7
6.3
10.9
2.0
1.7
Bharat Electronics
Neutral
162
-
36,084
8,137
9,169
16.8
17.2
58.7
62.5
2.8
2.6
0.4
0.4
44.6
46.3
3.4
3.1
Stock Watch
July 03, 2017
Company Name
Reco
CMP
Target
Mkt Cap
Sales ( Čcr )
OPM(%)
EPS (Č)
PER(x)
P/BV(x)
RoE(%)
EV/Sales(x)
(Č)
Price ( Č)
( Č cr )
FY17E
FY18E
FY17E
FY18E
FY17E
FY18E
FY17E
FY18E
FY17E
FY18E
FY17E
FY18E
FY17E
FY18E
Capital Goods
Voltas
Neutral
458
-
15,150
6,511
7,514
7.9
8.7
12.9
16.3
35.5
28.1
6.4
5.6
16.7
18.5
2.1
1.8
BGR Energy
Neutral
142
-
1,024
16,567
33,848
6.0
5.6
7.8
5.9
18.2
24.0
1.0
1.0
4.7
4.2
0.2
0.1
BHEL
Neutral
135
-
33,128
28,797
34,742
-
2.8
2.3
6.9
58.9
19.6
1.0
1.0
1.3
4.8
0.8
0.6
Blue Star
Buy
601
760
5,745
4,283
5,077
5.9
7.3
14.9
22.1
40.4
27.1
7.8
6.6
20.4
26.4
1.4
1.2
CG Power and Industrial
Neutral
82
-
5,146
5,777
6,120
5.9
7.0
3.3
4.5
24.9
18.2
1.1
1.0
4.4
5.9
0.8
0.7
Solutions
Greaves Cotton
Neutral
162
-
3,962
1,755
1,881
16.8
16.9
7.8
8.5
20.8
19.1
4.2
3.9
20.6
20.9
2.0
1.8
Inox Wind
Neutral
142
-
3,157
5,605
6,267
15.7
16.4
24.8
30.0
5.7
4.7
1.6
1.2
25.9
24.4
0.6
0.5
KEC International
Neutral
257
-
6,610
9,294
10,186
7.9
8.1
9.9
11.9
26.0
21.6
3.8
3.3
15.6
16.3
0.9
0.9
KEI Industries
Accumulate
232
258
1,808
2,633
3,001
10.4
10.0
12.7
13.0
18.3
17.9
3.9
3.3
21.4
18.2
0.9
0.8
Thermax
Neutral
939
-
11,193
5,421
5,940
7.3
7.3
25.7
30.2
36.6
31.1
4.4
4.0
12.2
13.1
1.9
1.8
VATech Wabag
Neutral
689
-
3,759
3,136
3,845
8.9
9.1
26.0
35.9
26.5
19.2
3.3
2.8
13.4
15.9
1.1
0.9
Cement
ACC
Neutral
1,568
-
29,444
11,225
13,172
13.2
16.9
44.5
75.5
35.2
20.8
3.3
3.1
11.2
14.2
2.6
2.2
Ambuja Cements
Neutral
246
-
48,817
9,350
10,979
18.2
22.5
5.8
9.5
42.4
25.9
3.6
3.2
10.2
12.5
5.2
4.5
India Cements
Neutral
197
-
6,081
4,364
4,997
18.5
19.2
7.9
11.3
25.0
17.5
1.8
1.8
8.0
8.5
2.2
1.9
JK Cement
Neutral
940
-
6,568
4,398
5,173
15.5
17.5
31.2
55.5
30.1
16.9
3.6
3.1
12.0
15.5
2.0
1.7
J K Lakshmi Cement
Neutral
484
-
5,693
2,913
3,412
14.5
19.5
7.5
22.5
64.5
21.5
4.0
3.3
12.5
18.0
2.5
2.1
Orient Cement
Neutral
141
-
2,891
2,114
2,558
18.5
20.5
8.1
11.3
17.4
12.5
2.6
2.2
9.0
14.0
2.0
1.6
UltraTech Cement
Neutral
3,963
-
108,800
25,768
30,385
21.0
23.5
111.0
160.0
35.7
24.8
4.6
4.0
13.5
15.8
4.3
3.6
Construction
ITNL
Neutral
95
-
3,132
8,946
10,017
31.0
31.6
8.1
9.1
11.8
10.5
0.4
0.4
4.2
5.0
3.7
3.4
KNR Constructions
Neutral
208
-
2,923
1,385
1,673
14.7
14.0
41.2
48.5
5.0
4.3
0.9
0.8
14.9
15.2
2.2
1.8
Larsen & Toubro
Neutral
1,688
-
157,542
111,017
124,908
11.0
11.0
61.1
66.7
27.6
25.3
3.3
3.1
13.1
12.9
2.5
2.3
Gujarat Pipavav Port
Neutral
150
-
7,227
705
788
52.2
51.7
5.0
5.6
29.9
26.7
3.0
2.7
11.2
11.2
9.9
8.4
Nagarjuna Const.
Neutral
88
-
4,864
8,842
9,775
9.1
8.8
5.3
6.4
16.5
13.7
1.3
1.2
8.2
9.1
0.7
0.6
PNC Infratech
Neutral
143
-
3,663
2,350
2,904
13.1
13.2
9.0
8.8
15.9
16.2
0.6
0.5
15.9
13.9
1.7
1.4
Simplex Infra
Neutral
510
-
2,522
6,829
7,954
10.5
10.5
31.4
37.4
16.2
13.6
1.7
1.5
9.9
13.4
0.8
0.7
Power Mech Projects
Neutral
585
-
861
1,801
2,219
12.7
14.6
72.1
113.9
8.1
5.1
1.5
1.3
16.8
11.9
0.5
0.4
Sadbhav Engineering
Neutral
312
-
5,354
3,598
4,140
10.3
10.6
9.0
11.9
34.7
26.2
3.6
3.2
9.9
11.9
1.8
1.5
NBCC
Neutral
203
-
18,225
7,428
9,549
7.9
8.6
8.2
11.0
24.7
18.4
1.2
1.0
28.2
28.7
2.2
1.6
MEP Infra
Neutral
111
-
1,800
1,877
1,943
30.6
29.8
3.0
4.2
36.9
26.4
17.9
12.0
0.6
0.6
2.3
2.2
Stock Watch
July 03, 2017
Company Name
Reco
CMP
Target
Mkt Cap
Sales ( Čcr )
OPM(%)
EPS (Č)
PER(x)
P/BV(x)
RoE(%)
EV/Sales(x)
(Č)
Price ( Č)
( Č cr )
FY17E
FY18E
FY17E
FY18E
FY17E
FY18E
FY17E
FY18E
FY17E
FY18E
FY17E
FY18E
FY17E
FY18E
Construction
SIPL
Neutral
109
-
3,827
1,036
1,252
65.5
66.2
(8.4)
(5.6)
4.1
4.6
(22.8)
(15.9)
11.9
9.9
Engineers India
Neutral
154
-
10,357
1,725
1,935
16.0
19.1
11.4
13.9
13.5
11.1
1.9
1.8
13.4
15.3
4.9
4.4
Financials
Axis Bank
Accumulate
516
580
123,706
46,932
53,575
3.5
3.4
32.4
44.6
16.0
11.6
2.1
1.8
13.6
16.5
-
-
Bank of Baroda
Neutral
161
-
37,120
19,980
23,178
1.8
1.8
11.5
17.3
14.0
9.3
1.6
1.3
8.3
10.1
-
-
Canara Bank
Neutral
329
-
19,651
15,225
16,836
1.8
1.8
14.5
28.0
22.7
11.8
1.6
1.3
5.8
8.5
-
-
Can Fin Homes
Neutral
3,233
-
8,605
420
526
3.5
3.5
86.5
107.8
37.4
30.0
8.0
6.6
23.6
24.1
-
-
Cholamandalam Inv. &
Accumulate
1,124
1,230
17,570
2,012
2,317
6.3
6.3
42.7
53.6
26.3
21.0
4.2
3.6
16.9
18.3
-
-
Fin. Co.
Dewan Housing Finance Buy
437
520
13,708
2,225
2,688
2.9
2.9
29.7
34.6
14.7
12.6
2.4
1.6
16.1
14.8
-
-
Equitas Holdings
Buy
150
235
5,074
939
1,281
11.7
11.5
5.8
8.2
25.9
18.3
2.2
2.0
10.9
11.5
-
-
Federal Bank
Accumulate
113
125
19,466
8,259
8,995
3.0
3.0
4.3
5.6
26.2
20.1
2.2
2.1
8.5
10.1
-
-
HDFC
Neutral
1,616
-
257,467
11,475
13,450
3.4
3.4
45.3
52.5
35.7
30.8
6.9
6.1
20.2
20.5
-
-
HDFC Bank
Neutral
1,652
-
425,270
46,097
55,433
4.5
4.5
58.4
68.0
28.3
24.3
5.0
4.2
18.8
18.6
-
-
ICICI Bank
Accumulate
290
315
186,036
42,800
44,686
3.1
3.3
18.0
21.9
16.1
13.3
2.2
2.0
11.1
12.3
-
-
Karur Vysya Bank
Accumulate
145
160
8,744
5,640
6,030
3.3
3.2
8.9
10.0
16.3
14.5
1.7
1.6
11.2
11.4
-
-
Lakshmi Vilas Bank
Neutral
200
-
3,827
3,339
3,799
2.7
2.8
11.0
14.0
18.1
14.3
1.9
1.7
11.2
12.7
-
-
LIC Housing Finance
Neutral
744
-
37,524
3,712
4,293
2.6
2.5
39.0
46.0
19.1
16.2
3.6
3.1
19.9
20.1
-
-
Punjab Natl.Bank
Neutral
137
-
29,185
23,532
23,595
2.3
2.4
6.8
12.6
20.2
10.9
3.1
2.2
3.3
6.5
-
-
RBL Bank
Neutral
508
-
19,123
1,783
2,309
2.6
2.6
12.7
16.4
40.0
31.0
4.4
3.9
12.8
13.3
-
-
Repco Home Finance
Neutral
825
-
5,161
388
457
4.5
4.2
30.0
38.0
27.5
21.7
4.6
3.8
18.0
19.2
-
-
South Ind.Bank
Neutral
28
-
5,014
6,435
7,578
2.5
2.5
2.7
3.1
10.3
9.0
1.3
1.1
10.1
11.2
-
-
St Bk of India
Neutral
274
-
236,173
88,650
98,335
2.6
2.6
13.5
18.8
20.3
14.6
1.9
1.7
7.0
8.5
-
-
Union Bank
Neutral
147
-
10,126
13,450
14,925
2.3
2.3
25.5
34.5
5.8
4.3
0.8
0.7
7.5
10.2
-
-
Yes Bank
Neutral
1,462
-
66,874
8,978
11,281
3.3
3.4
74.0
90.0
19.8
16.2
3.8
3.2
17.0
17.2
-
-
FMCG
Akzo Nobel India
Neutral
1,833
-
8,790
2,955
3,309
13.3
13.7
57.2
69.3
32.1
26.4
10.5
8.8
32.7
33.3
2.8
2.4
Asian Paints
Neutral
1,104
-
105,910
17,128
18,978
16.8
16.4
19.1
20.7
57.8
53.3
20.1
19.0
34.8
35.5
6.1
5.5
Britannia
Neutral
3,695
-
44,345
9,594
11,011
14.6
14.9
80.3
94.0
46.0
39.3
18.9
14.6
41.2
-
4.5
3.9
Colgate
Neutral
1,112
-
30,234
4,605
5,149
23.4
23.4
23.8
26.9
46.7
41.3
25.9
20.2
64.8
66.8
6.5
5.8
Dabur India
Neutral
292
-
51,463
8,315
9,405
19.8
20.7
8.1
9.2
36.1
31.8
10.0
8.3
31.6
31.0
5.8
5.1
GlaxoSmith Con*
Neutral
5,350
-
22,500
4,350
4,823
21.2
21.4
179.2
196.5
29.9
27.2
7.9
6.7
27.1
26.8
4.6
4.0
Stock Watch
July 03, 2017
Company Name
Reco
CMP
Target
Mkt Cap
Sales ( Čcr )
OPM(%)
EPS (Č)
PER(x)
P/BV(x)
RoE(%)
EV/Sales(x)
(Č)
Price ( Č)
( Č cr )
FY17E FY18E
FY17E
FY18E
FY17E
FY18E
FY17E
FY18E
FY17E
FY18E
FY17E
FY18E
FY17E
FY18E
FMCG
Godrej Consumer
Neutral
965
-
65,750
10,235
11,428
18.4
18.6
41.1
44.2
23.5
21.8
5.2
4.4
24.9
24.8
6.5
5.8
HUL
Neutral
1,082
-
234,108
35,252
38,495
17.8
17.8
20.7
22.4
52.4
48.3
50.1
42.9
95.6
88.9
6.5
5.9
ITC
Neutral
324
-
393,393
40,059
44,439
38.3
39.2
9.0
10.1
36.1
32.0
10.1
8.8
27.8
27.5
9.3
8.4
Marico
Neutral
314
-
40,514
6,430
7,349
18.8
19.5
6.4
7.7
49.1
40.8
14.8
12.5
33.2
32.5
6.1
5.3
Nestle*
Neutral
6,723
-
64,821
10,073
11,807
20.7
21.5
124.8
154.2
53.9
43.6
22.1
19.9
34.8
36.7
6.2
5.3
Tata Global
Neutral
151
-
9,508
8,675
9,088
9.8
9.8
7.4
8.2
20.4
18.4
1.6
1.5
7.9
8.1
1.0
1.0
Procter & Gamble
Neutral
8,023
-
26,044
2,939
3,342
23.2
23.0
146.2
163.7
54.9
49.0
13.9
11.5
25.3
23.5
8.4
7.3
Hygiene
IT
HCL Tech^
Buy
851
1,014
121,380
46,723
52,342
22.1
20.9
60.0
62.8
14.2
13.5
3.6
3.0
25.3
22.4
2.3
2.0
Infosys
Buy
936
1,179
214,914
68,484
73,963
26.0
26.0
63.0
64.0
14.9
14.6
3.1
2.9
20.8
19.7
2.8
2.5
TCS
Accumulate
2,364
2,651
465,878
117,966
127,403
27.5
27.6
134.3
144.5
17.6
16.4
5.2
4.9
29.8
29.7
3.6
3.4
Tech Mahindra
Buy
381
533
37,199
29,141
31,051
14.4
15.0
32.3
35.6
11.8
10.7
2.0
1.8
17.1
17.0
1.1
1.0
Wipro
Accumulate
259
280
125,912
55,421
58,536
20.3
20.3
35.1
36.5
7.4
7.1
1.3
1.1
19.2
14.6
1.7
1.5
Media
D B Corp
Neutral
380
-
6,994
2,297
2,590
27.4
28.2
21.0
23.4
18.1
16.3
4.2
3.7
23.7
23.1
2.8
2.5
HT Media
Neutral
81
-
1,882
2,693
2,991
12.6
12.9
7.9
9.0
10.2
9.0
0.9
0.8
7.8
8.3
0.3
0.2
Jagran Prakashan
Buy
183
225
5,966
2,283
2,555
28.0
28.0
10.6
12.3
17.2
14.9
3.7
3.2
21.4
21.4
2.6
2.3
Sun TV Network
Neutral
814
-
32,071
2,850
3,265
70.1
71.0
26.2
30.4
31.1
26.8
8.0
7.0
24.3
25.6
10.8
9.3
Hindustan Media
Neutral
270
-
1,983
1,016
1,138
24.3
25.2
27.3
30.1
9.9
9.0
1.9
1.7
16.2
15.8
1.3
1.1
Ventures
TV Today Network
Buy
239
344
1,425
608
667
21.5
22.3
15.7
19.2
15.2
12.4
2.3
2.0
16.1
16.0
1.9
1.7
Metals & Mining
Coal India
Neutral
244
-
151,585
84,638
94,297
21.4
22.3
24.5
27.1
10.0
9.0
4.2
4.0
42.6
46.0
1.3
1.2
Hind. Zinc
Neutral
263
-
111,063
14,252
18,465
55.9
48.3
15.8
21.5
16.6
12.2
2.7
2.4
17.0
20.7
7.8
6.0
Hindalco
Neutral
191
-
42,748
107,899
112,095
7.4
8.2
9.2
13.0
20.7
14.7
1.0
0.9
4.8
6.6
0.9
0.9
JSW Steel
Neutral
203
-
49,130
53,201
58,779
16.1
16.2
130.6
153.7
1.6
1.3
0.2
0.2
14.0
14.4
1.7
1.5
NMDC
Neutral
108
-
34,265
6,643
7,284
44.4
47.7
7.1
7.7
15.3
14.1
1.3
1.3
8.8
9.2
2.9
2.6
SAIL
Neutral
58
-
24,099
47,528
53,738
(0.7)
2.1
(1.9)
2.6
22.4
0.6
0.6
(1.6)
3.9
1.4
1.2
Vedanta
Neutral
249
-
92,577
71,744
81,944
19.2
21.7
13.4
20.1
18.6
12.4
1.6
1.4
8.4
11.3
1.7
1.3
Tata Steel
Neutral
544
-
52,868
121,374
121,856
7.2
8.4
18.6
34.3
29.3
15.9
1.8
1.7
6.1
10.1
1.1
1.1
Oil & Gas
GAIL
Neutral
361
-
61,056
56,220
65,198
9.3
10.1
27.1
33.3
13.3
10.8
1.2
1.1
9.3
10.7
1.3
1.1
ONGC
Neutral
157
-
201,867
137,222
152,563
15.0
21.8
19.5
24.1
8.1
6.5
0.7
0.7
8.5
10.1
1.8
1.6
Indian Oil Corp
Neutral
385
-
187,049
373,359
428,656
5.9
5.5
54.0
59.3
7.1
6.5
1.1
1.0
16.0
15.6
0.7
0.6
Stock Watch
July 03, 2017
Company Name
Reco
CMP
Target
Mkt Cap
Sales ( Čcr )
OPM(%)
EPS (Č)
PER(x)
P/BV(x)
RoE(%)
EV/Sales(x)
(Č)
Price ( Č)
( Č cr )
FY17E FY18E
FY17E
FY18E
FY17E
FY18E
FY17E
FY18E
FY17E
FY18E
FY17E
FY18E
FY17E
FY18E
Oil & Gas
Reliance Industries
Neutral
1,380
-
448,797
301,963
358,039
12.1
12.6
87.7
101.7
15.7
13.6
1.6
1.5
10.7
11.3
2.0
1.6
Pharmaceuticals
Alembic Pharma
Buy
503
648
9,476
3,101
3,966
19.7
20.5
21.4
25.5
23.5
19.7
5.0
4.1
23.0
22.8
3.0
2.2
Alkem Laboratories Ltd
Buy
1,856
2,161
22,186
5,853
6,901
17.1
18.4
74.6
85.0
24.9
21.8
5.3
4.4
21.1
20.2
3.8
3.2
Aurobindo Pharma
Buy
683
823
40,042
14,845
17,086
21.5
22.1
39.4
44.7
17.4
15.3
4.3
3.4
27.6
24.7
2.9
2.5
Aventis*
Neutral
4,162
-
9,584
2,206
2,508
16.6
16.8
128.9
139.9
32.3
29.8
5.5
4.3
21.6
23.5
4.1
3.4
Cadila Healthcare
Reduce
526
450
53,808
9,220
11,584
18.4
20.3
14.5
18.7
36.3
28.1
7.7
6.3
23.5
24.6
6.2
4.7
Cipla
Sell
554
461
44,601
14,281
16,619
15.4
16.2
12.5
19.7
44.4
28.1
3.6
3.2
8.4
12.0
3.3
2.8
Dr Reddy's
Neutral
2,683
-
44,458
14,081
15,937
16.1
18.6
72.6
105.9
37.0
25.3
3.6
3.3
9.6
13.6
3.4
3.0
Dishman Pharma
Sell
143
1,718
1,890
22.7
22.8
9.5
11.3
10.1
10.9
3.3
2.9
GSK Pharma*
Neutral
2,499
-
21,164
2,927
3,290
11.8
16.2
34.4
49.6
72.6
50.4
10.6
11.0
13.9
21.3
7.0
6.3
Indoco Remedies
Sell
202
153
1,864
1,067
1,154
12.1
14.9
8.4
11.3
24.1
17.9
2.9
2.5
12.6
15.0
1.9
1.8
Ipca labs
Buy
491
620
6,198
3,211
3,593
13.9
14.5
15.4
19.4
31.9
25.3
2.5
2.3
8.2
9.5
2.1
1.8
Lupin
Buy
1,060
1,526
47,901
17,120
18,657
24.1
24.1
56.9
61.1
18.6
17.4
3.5
3.0
20.7
18.6
3.1
2.5
Natco Pharma
Accumulate
1,002
1,060
17,460
2,065
1,988
33.1
33.7
27.9
25.7
35.9
39.0
10.5
8.9
29.2
22.9
8.6
8.6
Sun Pharma
Buy
555
712
133,038
30,264
32,899
29.0
26.9
32.7
31.6
17.0
17.6
3.6
3.1
22.2
18.7
4.1
3.7
Power
Tata Power
Neutral
81
-
21,787
36,916
39,557
17.4
27.1
5.1
6.3
15.8
12.8
1.4
1.3
9.0
10.3
1.6
1.4
NTPC
Neutral
158
-
130,649
86,605
95,545
17.5
20.8
11.8
13.4
13.4
11.8
1.4
1.3
10.5
11.1
2.9
2.8
Power Grid
Accumulate
211
223
110,151
25,315
29,193
88.2
88.7
14.2
17.2
14.9
12.3
2.3
2.0
15.2
16.1
9.0
8.1
Real Estate
Prestige Estate
Neutral
251
-
9,429
4,707
5,105
25.2
26.0
10.3
13.0
24.4
19.3
2.0
1.8
10.3
10.2
3.2
2.8
MLIFE
Buy
431
522
2,210
1,152
1,300
22.7
24.6
29.9
35.8
14.4
12.0
1.1
1.0
7.6
8.6
2.6
2.2
Telecom
Bharti Airtel
Neutral
379
-
151,561
105,086
114,808
34.5
34.7
12.2
16.4
31.1
23.1
2.1
2.0
6.8
8.4
2.4
2.1
Idea Cellular
Neutral
85
-
30,670
40,133
43,731
37.2
37.1
6.4
6.5
13.3
13.1
1.1
1.0
8.2
7.6
1.8
1.5
zOthers
Abbott India
Neutral
4,210
-
8,945
3,153
3,583
14.1
14.4
152.2
182.7
27.7
23.0
135.8
116.0
25.6
26.1
2.5
2.2
Asian Granito
Neutral
431
-
1,296
1,066
1,169
11.6
12.5
13.0
16.0
33.1
27.0
3.2
2.9
9.5
10.7
1.5
1.3
Bajaj Electricals
Buy
327
395
3,319
4,801
5,351
5.7
6.2
10.4
13.7
31.4
23.9
3.9
3.5
12.4
14.5
0.7
0.6
Banco Products (India)
Neutral
218
-
1,560
1,353
1,471
12.3
12.4
14.5
16.3
15.0
13.4
20.8
18.7
14.5
14.6
1.1
117.4
Coffee Day Enterprises
Neutral
247
-
5,082
2,964
3,260
20.5
21.2
4.7
8.0
-
30.8
2.9
2.6
5.5
8.5
2.1
1.9
Ltd
Competent Automobiles Neutral
187
-
120
1,137
1,256
3.1
2.7
28.0
23.6
6.7
7.9
36.1
32.6
14.3
11.5
0.1
0.1
Elecon Engineering
Neutral
57
-
640
1,482
1,660
13.7
14.5
3.9
5.8
14.6
9.8
3.4
3.2
7.8
10.9
0.8
0.7
Stock Watch
July 03, 2017
Company Name
Reco
CMP
Target
Mkt Cap
Sales ( Čcr )
OPM(%)
EPS (Č)
PER(x)
P/BV(x)
RoE(%)
EV/Sales(x)
(Č)
Price ( Č)
( Č cr )
FY17E
FY18E
FY17E
FY18E
FY17E
FY18E
FY17E
FY18E
FY17E
FY18E
FY17E
FY18E
FY17E
FY18E
zOthers
Finolex Cables
Neutral
458
-
7,009
2,883
3,115
12.0
12.1
14.2
18.6
32.3
24.6
17.2
15.0
15.8
14.6
2.1
1.9
Garware Wall Ropes
Neutral
816
-
1,785
863
928
15.1
15.2
36.4
39.4
22.4
20.7
4.1
3.5
17.5
15.9
2.0
1.8
Goodyear India*
Neutral
886
-
2,043
1,598
1,704
10.4
10.2
49.4
52.6
17.9
16.8
82.8
72.6
18.2
17.0
1.0
137.5
Hitachi
Neutral
2,003
-
5,445
2,081
2,433
8.8
8.9
33.4
39.9
60.0
50.2
48.4
40.3
22.1
21.4
2.6
2.2
HSIL
Neutral
365
-
2,639
2,384
2,515
15.8
16.3
15.3
19.4
23.9
18.8
23.7
20.4
7.8
9.3
1.3
1.2
Interglobe Aviation
Neutral
1,167
-
42,182
21,122
26,005
14.5
27.6
110.7
132.1
10.5
8.8
63.1
45.0
168.5
201.1
2.0
1.6
Jyothy Laboratories
Neutral
356
-
6,467
1,440
2,052
11.5
13.0
8.5
10.0
41.9
35.6
10.1
9.4
18.6
19.3
4.8
3.3
Kirloskar Engines India
Neutral
400
-
5,785
2,554
2,800
9.9
10.0
10.5
12.1
38.1
33.1
15.9
15.0
10.7
11.7
1.9
1.7
Ltd
Linc Pen & Plastics
Neutral
273
-
403
382
420
9.3
9.5
13.5
15.7
20.2
17.4
3.5
3.0
17.1
17.3
1.1
1.0
M M Forgings
Neutral
613
-
740
546
608
20.4
20.7
41.3
48.7
14.9
12.6
84.0
74.3
16.6
17.0
1.2
1.1
Manpasand Bever.
Neutral
787
-
4,505
836
1,087
19.6
19.4
16.9
23.8
46.6
33.1
5.6
4.9
12.0
14.8
5.1
3.9
Mirza International
Neutral
153
-
1,845
963
1,069
17.2
18.0
6.1
7.5
25.0
20.4
3.8
3.3
15.0
15.7
2.1
1.9
MT Educare
Neutral
63
-
250
366
417
17.7
18.2
9.4
10.8
6.7
5.8
1.5
1.3
22.2
22.3
0.6
0.5
Narayana Hrudaya
Neutral
314
-
6,422
1,873
2,166
11.5
11.7
2.6
4.0
118.8
79.3
7.3
6.6
6.1
8.3
3.5
3.0
Navkar Corporation
Buy
202
265
2,882
347
371
43.2
37.3
6.7
6.0
30.3
33.7
2.1
1.9
6.2
10.6
9.4
8.8
Navneet Education
Neutral
179
-
4,187
1,062
1,147
24.0
24.0
6.1
6.6
29.4
27.1
6.1
5.4
20.6
19.8
4.0
3.7
Nilkamal
Neutral
1,884
-
2,812
1,995
2,165
10.7
10.4
69.8
80.6
27.0
23.4
107.7
93.5
16.6
16.5
1.4
1.3
Page Industries
Neutral
16,678
-
18,603
2,450
3,124
20.1
17.6
299.0
310.0
55.8
53.8
371.5
283.6
47.1
87.5
7.6
6.0
Parag Milk Foods
Neutral
216
-
1,818
1,919
2,231
9.3
9.6
9.5
12.9
22.9
16.7
3.6
2.9
15.5
17.5
1.1
0.9
Quick Heal
Neutral
206
-
1,449
408
495
27.3
27.0
7.7
8.8
26.7
23.5
2.5
2.5
9.3
10.6
2.7
2.2
Radico Khaitan
Buy
121
147
1,616
1,667
1,824
13.0
13.2
6.7
8.2
18.3
14.8
1.7
1.5
9.0
10.2
1.4
1.2
Relaxo Footwears
Neutral
482
-
5,788
2,085
2,469
9.2
8.2
7.6
8.0
63.7
60.6
24.7
21.1
17.9
18.8
2.9
2.4
S H Kelkar & Co.
Neutral
264
-
3,814
1,036
1,160
15.1
15.0
6.1
7.2
43.2
36.7
4.6
4.2
10.7
11.5
3.6
3.1
Siyaram Silk Mills
Buy
1,996
2,500
1,871
1,574
1,769
12.5
12.7
97.1
113.1
20.6
17.6
3.2
2.7
15.4
15.5
1.4
1.2
Styrolution ABS India*
Neutral
832
-
1,464
1,440
1,537
9.2
9.0
40.6
42.6
20.5
19.5
52.4
47.6
12.3
11.6
1.0
0.9
Surya Roshni
Neutral
282
-
1,238
3,342
3,625
7.8
7.5
17.3
19.8
16.3
14.3
31.0
24.9
10.5
10.8
0.6
0.6
Team Lease Serv.
Neutral
1,344
-
2,298
3,229
4,001
1.5
1.8
22.8
32.8
59.0
40.9
6.3
5.5
10.7
13.4
0.6
0.5
The Byke Hospitality
Neutral
187
-
751
287
384
20.5
20.5
7.6
10.7
24.6
17.5
5.1
4.2
20.7
23.5
2.6
2.0
Transport Corporation of
Neutral
330
-
2,526
2,671
2,911
8.5
8.8
13.9
15.7
23.8
21.1
3.3
2.9
13.7
13.8
1.1
1.0
India
Stock Watch
July 03, 2017
Company Name
Reco
CMP
Target Mkt Cap
Sales ( Čcr )
OPM(%)
EPS (Č)
PER(x)
P/BV(x)
RoE(%)
EV/Sales(x)
(Č)
Price ( Č)
( Č cr )
FY17E FY18E FY17E FY18E FY17E FY18E FY17E FY18E FY17E FY18E FY17E FY18E FY17E FY18E
zOthers
TVS Srichakra
Neutral
3,771
-
2,888
2,304
2,614
13.7
13.8
231.1
266.6
16.3
14.2
423.8
333.7
33.9
29.3
1.3
1.1
UFO Moviez
Neutral
395
-
1,090
619
685
33.2
33.4
30.0
34.9
13.2
11.3
1.8
1.6
13.8
13.9
1.5
1.1
Visaka Industries
Neutral
506
-
803
1,051
1,138
10.3
10.4
21.0
23.1
24.1
21.9
64.8
60.7
9.0
9.2
1.0
1.0
VRL Logistics
Neutral
335
-
3,058
1,902
2,119
16.7
16.6
14.6
16.8
23.0
19.9
5.0
4.4
21.9
22.2
1.7
1.5
VIP Industries
Buy
182
218
2,573
1,270
1,450
10.4
10.4
5.6
6.5
32.5
28.0
6.7
5.9
20.7
21.1
2.0
1.8
Navin Fluorine
Buy
3,035
3,650
2,988
789
945
21.1
22.4
120.1
143.4
25.3
21.2
4.1
3.5
17.8
18.5
3.7
3.0
Source: Company, Angel Research; Note: *December year end; #September year end; &October year end; Price as on June 30, 2017
Market Outlook
July 03, 2017
Research Team Tel: 022 - 39357800
DISCLAIMER
Angel Broking Private Limited (hereinafter referred to as “Angel”) is a registered Member of National Stock Exchange of India
Limited,Bombay Stock Exchange Limited and Metropolitan Stock Exchange Limited. It is also registered as a Depository Participant with
CDSL and Portfolio Manager with SEBI. It also has registration with AMFI as a Mutual Fund Distributor. Angel Broking Private Limited is a
registered entity with SEBI for Research Analyst in terms of SEBI (Research Analyst) Regulations, 2014 vide registration number
INH000000164. Angel or its associates has not been debarred/ suspended by SEBI or any other regulatory authority for accessing
/dealing in securities Market. Angel or its associates/analyst has not received any compensation / managed or
co-managed public offering of securities of the company covered by Analyst during the past twelve months.
This document is solely for the personal information of the recipient, and must not be singularly used as the basis of any investment
decision. Nothing in this document should be construed as investment or financial advice. Each recipient of this document should make
such investigations as they deem necessary to arrive at an independent evaluation of an investment in the securities of the companies
referred to in this document (including the merits and risks involved), and should consult their own advisors to determine the merits and
risks of such an investment.
Reports based on technical and derivative analysis center on studying charts of a stock's price movement, outstanding positions and
trading volume, as opposed to focusing on a company's fundamentals and, as such, may not match with a report on a company's
fundamentals. Investors are advised to refer the Fundamental and Technical Research Reports available on our website to evaluate the
contrary view, if any.
The information in this document has been printed on the basis of publicly available information, internal data and other reliable
sources believed to be true, but we do not represent that it is accurate or complete and it should not be relied on as such, as this
document is for general guidance only. Angel Broking Pvt. Limited or any of its affiliates/ group companies shall not be in any way
responsible for any loss or damage that may arise to any person from any inadvertent error in the information contained in this report.
Angel Broking Pvt. Limited has not independently verified all the information contained within this document. Accordingly, we cannot
testify, nor make any representation or warranty, express or implied, to the accuracy, contents or data contained within this document.
While Angel Broking Pvt. Limited endeavors to update on a reasonable basis the information discussed in this material, there may be
regulatory, compliance, or other reasons that prevent us from doing so.
This document is being supplied to you solely for your information, and its contents, information or data may not be reproduced,
redistributed or passed on, directly or indirectly.
Neither Angel Broking Pvt. Limited, nor its directors, employees or affiliates shall be liable for any loss or damage that may arise from
or in connection with the use of this information.